Scrub the timeline to watch the campus get built out. Each capture pairs an aerial image with the standardized capacity status on that date.

Construction status
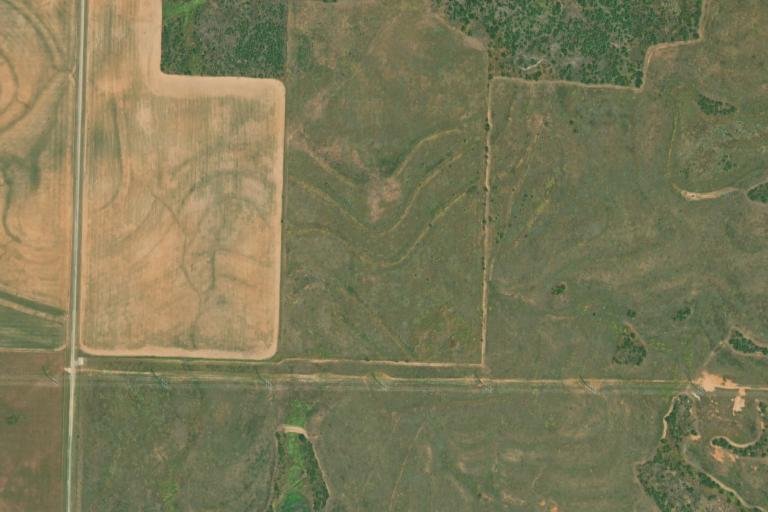
Drag the slider to wipe between two dated satellite captures — open Texas ranchland in August 2020 becomes a hyperscale AI data center campus by July 2025. Ziven Professional and API members can scrub the full dated timeline like this for every covered site, and compare any two captures side by side with the disclosed capacity status on each date.
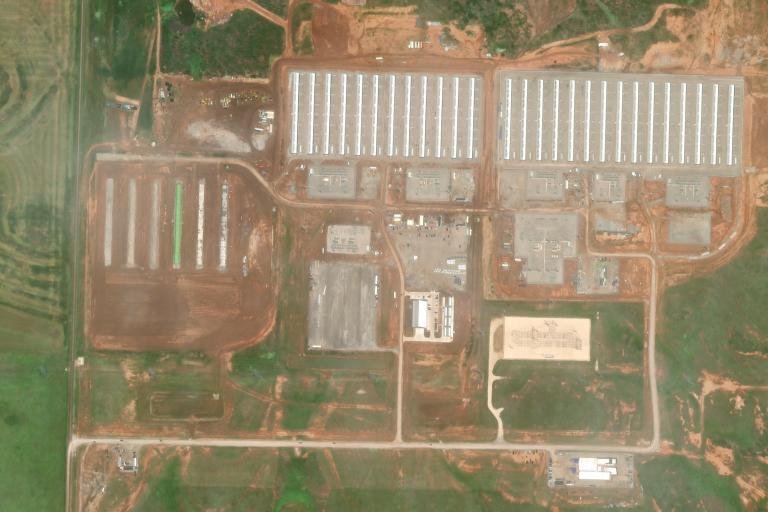
We're mapping the structures on every covered campus — data halls, substations, staging yards — along with the date each one first appears on satellite. Here's an illustrative preview on the July 2025 Childress capture:
Data halls
Substation
Laydown & staging
The Satellite Explorer pairs dated satellite imagery with Ziven's standardized capacity data, so you can watch an AI data center campus get built over time. Pick a site, scrub the timeline, and each capture shows the facility as it looked on that date alongside its energized, under-development, and pipeline megawatts. Imagery comes from dated archives, primarily the Esri World Imagery Wayback basemap, with USDA NAIP aerial captures and licensed imagery for some sites and dates; capacity figures come from the same sourced dataset that powers the AI data centers page and each site's capacity history. Timelines are offered for sites with confirmed precise coordinates, from hyperscale campuses rising in Texas to converted Bitcoin mining facilities, so the construction progress you see always matches the disclosed numbers on that date. The Satellite Explorer is included with Ziven Professional and API memberships.

