


The headline number on a hyperscaler deal is built to impress. Recent announcements like $6.6B, $19B and $5.2B... All big contract revenue but this number tells you little about value to shareholders.
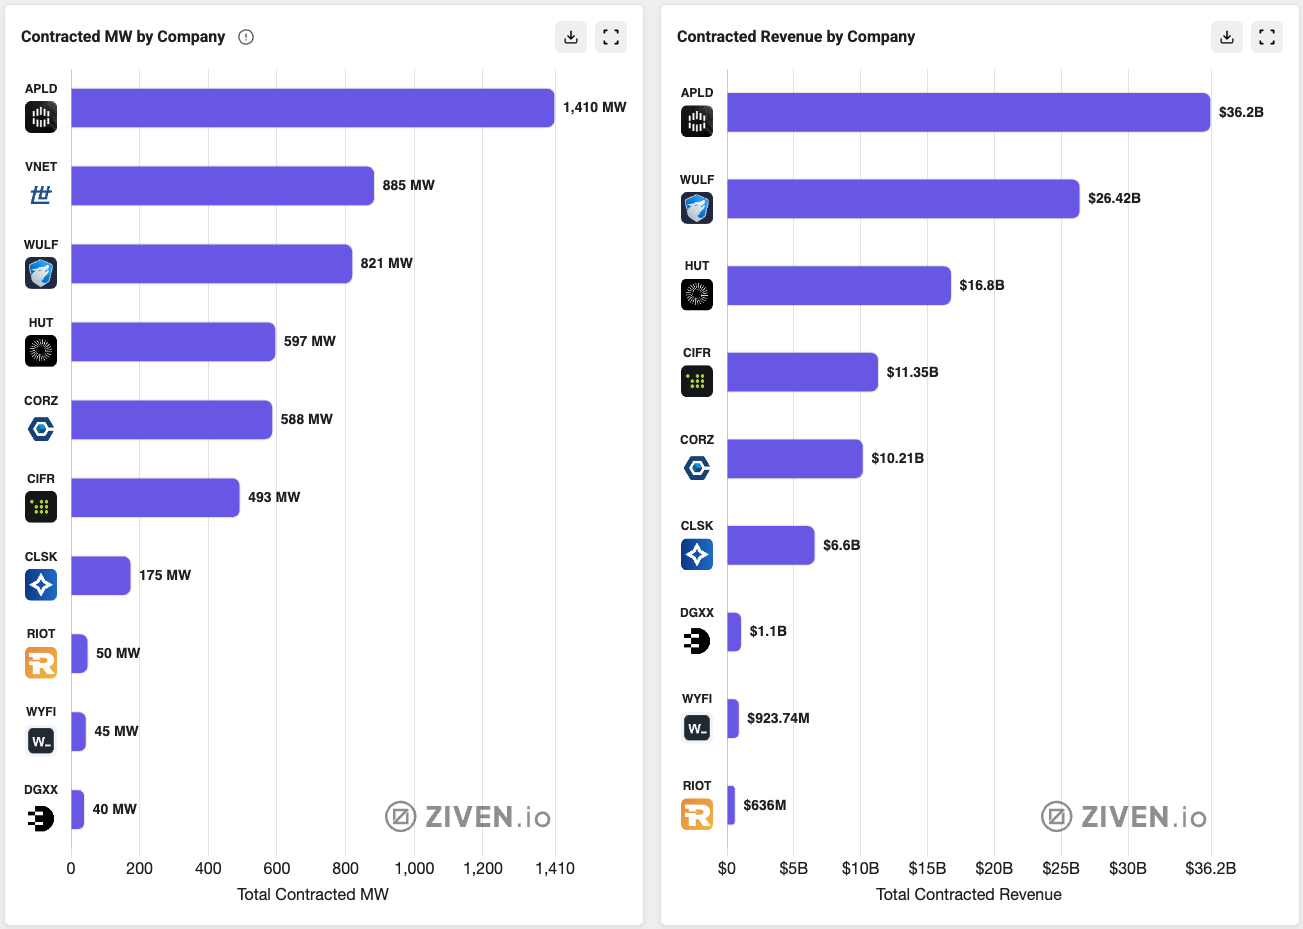
Most people will use revenue, sales or EBITDA multiples to evaluate stocks, but these metrics often don’t work well for data center businesses.
A colocation operator behaves far more like a landlord than a technology company. It builds the shell, the power, and the cooling, then leases that capacity to a tenant who brings its own servers and pays its own utility bills. The economics here is close to a property developer: a heavy upfront build, followed by years of stable, contracted rent. Growth multiples struggle here because they were designed to price earnings that can compound or collapse. A signed lease behaves differently. Its value rests on how durable and long-dated the rent is, and that is something a growth multiple was never built to measure.
So a better way to evaluate these deals is to check how a real estate investor evaluates a development project. Instead of asking how big the contract is, you ask how much value the company creates by building and leasing the campus. Ziven's colocation deal simulator and pricing calculator is built to show that. The model is inspired by Daniel's methodology and we simplify the whole valuation process by taking out some variables such as tax. With the current simulator, we focus on answering 2 questions: what a single deal is worth, and what all of a company's deals are worth per share.
Part 1: What one deal is really worth
When a company builds a data center for colocation services, it spends a large amount of money upfront. Once the campus is complete and leased, the market assigns it a value based on the income it can generate.
Value is created when the company’s return on the total cost of the campus exceeds the return investors demand for a stabilized, income-producing asset. The wider this gap between the two, the greater the value created by the project.
Three metrics help explain where the value comes from:
Yield on Cost measures the return the company earns on the capital it spends to build the campus.
Exit Cap Rate is the capitalization rate investors apply when valuing a completed, fully leased data center.
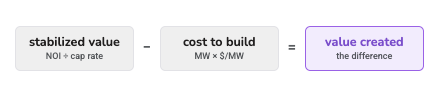
Value Created is simply the difference between the market value of the stabilized asset and its total development cost.
The value in a colocation deal comes from a simple gap: the operator builds the campus at a relatively high yield on cost, while the market values the same stabilized cash flows at a lower exit cap rate. This is how the majority of the economic return exits.
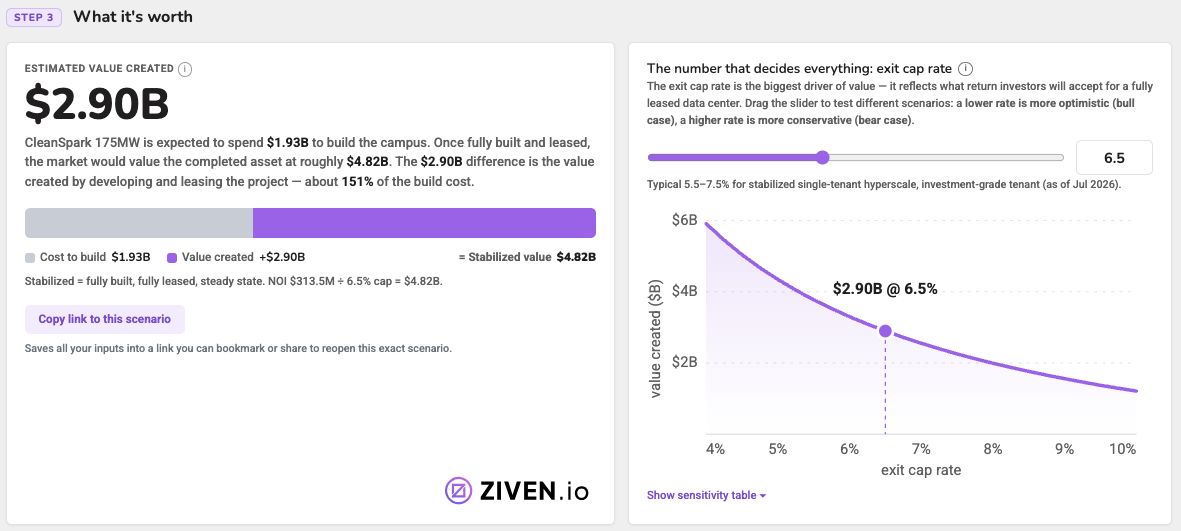
Applying these concepts to CleanSpark's case. The company is expected to invest roughly $1.93B ($11M/ MW x 175 MW) to develop the campus. Once the facility reaches stabilization (fully built and fully leased), the market is projected to value it at approximately $4.82B. This figure is derived by capitalizing the expected $313.5M in annual rental income at a 6.5% exit cap rate.
The difference of $2.9B, is the value created, which equates to ~150.5% of the total development cost. In other words, for every dollar CleanSpark invests in the project, it is expected to generate roughly $1.5 of additional value once the campus is stabilized. A simple revenue multiple does not capture this dynamic, which is the primary reason these transactions are economically attractive.
The exit cap rate is the single assumption that matters most in these valuations.
The $2.9B in value created is only as reliable as the 6.5% exit cap rate used to derive it. Because value is calculated by dividing stabilized rent by the cap rate, even small changes in that one input can move the result significantly.
Holding all other assumptions constant, lowering the exit cap rate to 5.5% increases the stabilized value of the campus to roughly $5.7B and pushes value created to approximately $3.77B. Raising the cap rate to 7.5% reduces the stabilized value to about $4.18B and lowers value created to roughly $2.25B. In other words, the same project, the same rent, and the same development cost can produce more than a $1.5 billion swing in value created depending on the cap rate chosen.
This is why the exit cap rate deserves more scrutiny than any other input. It reflects the market’s current assessment of the income’s certainty, the strength of the tenant, prevailing interest rates, and overall investor appetite for data center assets.
For this reason, any “value created” figure should always be presented alongside its assumed exit cap rate. Without that context, the number conceals the assumption doing most of the heavy lifting. A more transparent approach is to show what the deal is worth at the base-case cap rate (in this case 6.5%) and then illustrate how the outcome changes if the market applies a higher or lower rate.

One additional data point is worth examining: implied rent. CleanSpark’s stabilized rent equates to approximately $157 per kilowatt per month. This figure sits in the upper quartile of comparable colocation transactions we track. While paying a premium rent is not inherently problematic, it does mean the economics depend more heavily on the tenant’s willingness (and ability) to pay above-market rates. Understanding this upfront helps assess how much cushion or risk the deal actually carries.
Part 2: What the deals are worth per share
One deal is only a single data point. What investors ultimately buy and sell is the company itself. That is why the second half of the simulator focuses on stabilized NAV per share.
This approach values the business the same way investors typically value a real estate company or REIT, by estimating the market value of its assets rather than applying an earnings multiple.
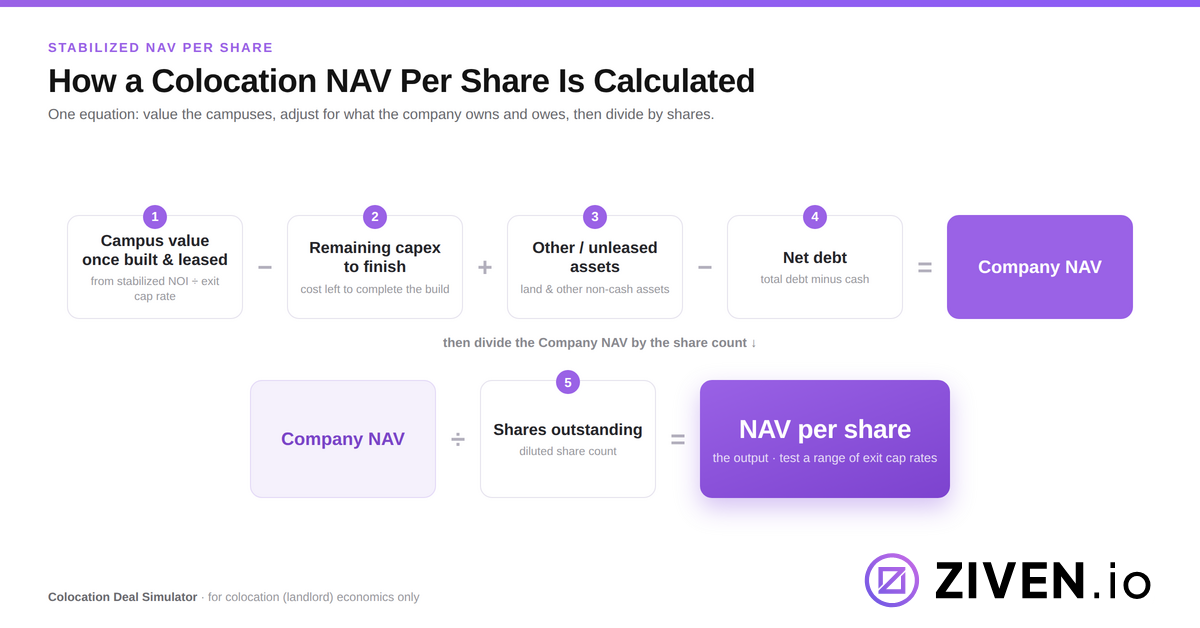
The output is an estimate of what the company’s equity would be worth if it successfully delivers on the colocation deals it has already signed.
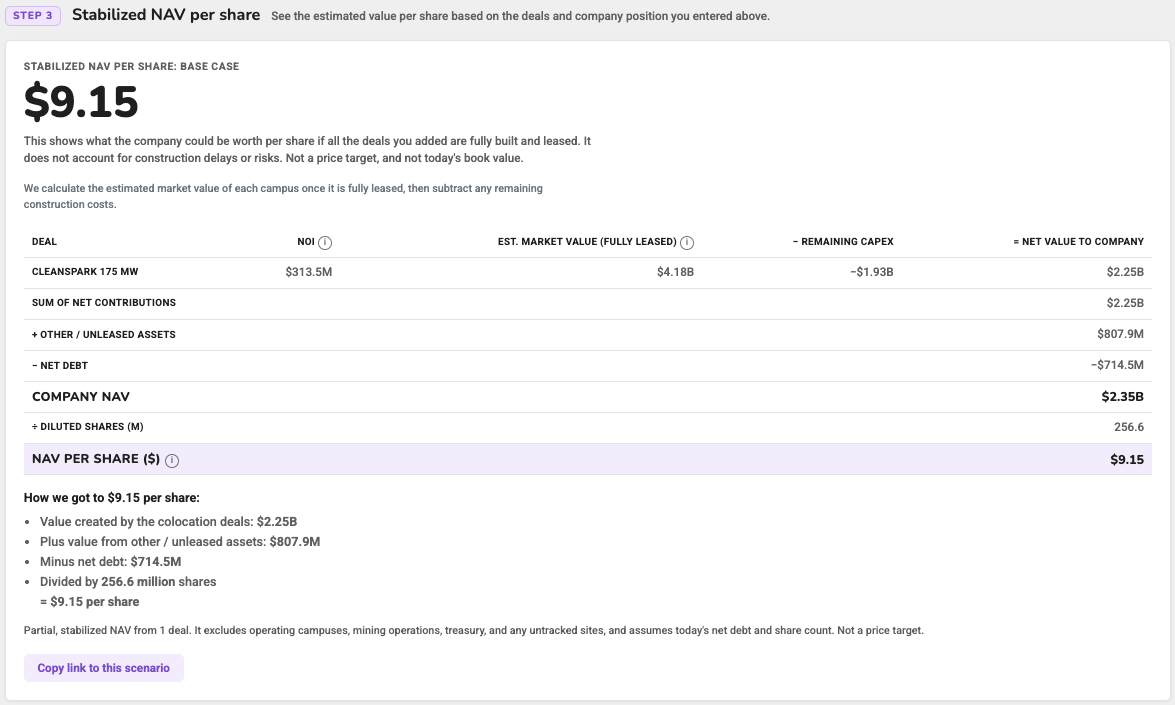
For CleanSpark, this stabilized NAV equals approximately $9.15* per share when using a 6.5% exit cap rate.
*This figure listed reflects only the company’s colocation deals you enter and excludes any other operating campuses, mining operations, treasury holdings, and untracked sites.
Think of this number as a snapshot of the company’s potential value once its current development pipeline reaches stabilization. It is not a price target, nor is it meant to represent the company’s current book value.
Important: you should read the whole range
Because the entire valuation is highly sensitive to the exit cap rate, the stabilized NAV framework presents three scenarios rather than a single number:

The roughly $3 spread between the bull and bear cases is the most useful part of the analysis. It shows how much the company’s equity value could vary depending on where the market ultimately prices stabilized data center assets. A single NAV figure tends to hide this uncertainty. By showing the full range of outcomes across different cap rate assumptions, the three-scenario view makes the key risks and sensitivities visible. It allows investors to decide where they believe the market is most likely to land when these campuses stabilize, and to size their conviction accordingly.
Putting it to work
Use the single-deal view to evaluate a new announcement and determine whether it creates value and by how much. Use the stabilized NAV view to assess the stock itself and see how the company’s potential value once stabilized compares with today’s share price. In both cases, the discipline remains the same: begin with the actual terms the company has announced, adjust the assumptions that matter most (starting with the exit cap rate), and consider the full range of outcomes rather than anchoring on a single number. The simulator performs the calculations instantly. Your real edge comes from the quality of your judgment on the inputs.
This framework is designed specifically for colocation deals and does not apply to AI cloud or GPU businesses. It works for colocation because these transactions involve contracted rent from a creditworthy tenant, the type of stable, lease-based income that a cap rate is meant to value. AI cloud and GPU companies operate differently. They own the hardware and sell compute capacity by the hour. There is generally no long-term lease and no predictable rent stream, only fluctuating utilization and hardware that generally depreciates over 3-5 years. Applying a cap rate approach to this type of income would significantly overstate its value. These businesses require a different analytical framework focused on EBITDA, utilization rates, and the hardware replacement cycle.
Before using this model, confirm that the transaction in question is a genuine colocation lease. If the company is selling compute by the hour instead, a different approach is needed.
Finally, a note on the model’s limitations: it is built on assumptions and does not incorporate construction delays, financing costs, taxes, or execution risk. The outputs should be treated as informed estimates intended to sharpen your thinking, not as forecasts of where the stock will trade.
🔖 Evaluate other colocation deals with the same framework at the Ziven Colocation Deal Simulator. Feedback and suggestions are welcome :)
Disclaimer: This article is provided for informational and educational purposes only and does not constitute investment advice or a recommendation to buy, sell, or hold any security. The simulator and figures presented are hypothetical and based on assumptions and simplifications. Actual results may differ materially from those shown. Any company or security mentioned, including CleanSpark, is used solely for illustrative purposes and should not be construed as a recommendation. Investing involves risk, including the loss of principal. Past performance is not indicative of future results. Please do your own research and consult a qualified financial professional before making any investment decisions.


